My Strava Dashboard
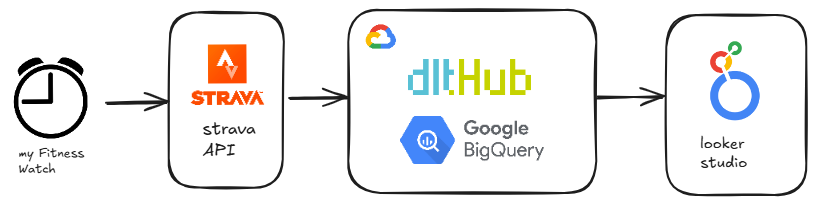
This project leverages the python dlthub package to extract workout, location, and performance data from the Strava API and ingest it into BigQuery cloudcin a structured, incremental fashion. Once ingested, BigQuery’s SQL-based transformation pipelines handle everything from unit conversions (like meters to miles and Celsius to Fahrenheit) to geometry decoding for route visualizations. These cleaned and enriched datasets become the foundation for dynamic dashboards in Looker Studio, where users can explore their activities through interactive charts, custom filters, and embedded maps that bring each route to life. The result is a fully automated, end-to-end analytics pipeline—from raw API to polished BI.
👉 "Displayed on the right is an interactive dashboard built with Looker Studio, showcasing my activities with real-time updates."